如何一步一步通过Prometheus和grafana来监控Oracle 18c数据库
一背景说明
本文档记录通过prometheus+grafana来监控Oracle 18C指标的操作指南。该文档是一个初步demo,后续会不断改善和迭代更新。
需求,一套运行在CentOS 7.6 X64平台的Oracle 18C数据库,想对其做一个基本的监控。于是,选择通过prometheus来采集和存储Oracle数据库的指标,然后在grafana上通过图形界面展示和查看。prometheus对于已经成熟的软件产品,比如操作系统本身,数据库软件等,它是无法直接去采集它们的指标数据的。需要通过一个exporter去拉取监控目标对象的指标,然后prometheus把这些指标存取起来,以时序数据库的格式存放。最后,通过grafana图形界面展示这些数据。所以,我这里通过运行一个oracledb-exporter,让它去抓取Oracle数据库的指标数据,然后prometheus来定期拉取这些数据。文中使用到的oracledb-exporter是直接运行在已有的一套3节点的Kubernetes集群中,并设置其中的pod指定为hostPort,让这个端口同时暴露在pod所在host机器上的端口,这样prometheus才可以去采集到这些metrics。
其中,各软件配置信息如下:
其中,各软件配置信息如下:
| 软件运行平台 | 软件版本 | 所在IP | |
|---|---|---|---|
| prometheus | macOS Monterey version 12.2.1 | 2.40.1 | localhost |
| grafana | macOS Monterey version 12.2.1 | 9.2.4 | localhost |
| Oracle | CentOS Linux release 7.6.1810 (Core) | 18.3.0.0.0 | 172.16.17.43 |
| kubernetes | CentOS Linux release 7.4.1708 (Core) | 1.23 | 172.16.11.168「master」172.16.11.148「node1」172.16.11.168「node2」 |
二 配置流程
0 启动运行oracledb-exporter
0.1 准备连接目标Oracle数据库的datasource信息
这里通过Kubernetes的secret来访问目标数据库,需要生成1个连接字符串
[root@master-node oracle_exporter]# echo -n system/system_user_password@//172.16.17.41:1521/devpdb|base64
c3lzdGVtL29yYWNsZUAvLzE3Mi4xNi4xNy40MToxNTIxL2RldnBkYg==
[root@master-node oracle_exporter]#
把连接目标库的用户、密码,IP,端口,数据库服务名,通过base64生成一个加密字符串。准备好的Kubernetes secret资源对象如下:
apiVersion: v1
kind: Secret
metadata:
  name:  oracledb-exporter-secret
  namespace: database-namespace
data:
    # Add here the result of:
    # echo -n YOUR_CONN_STRING | base64
    # YOUR_CONN_STRING be like: system/YOUR-PASS-FOR-SYSTEM@//database:1521/DB_SID.DB_DOMAIN
    datasource: c3lzdGVtL29yYWNsZUAvLzE3Mi4xNi4xNy40MToxNTIxL2RldnBkYg==
type: Opaque
0.2 准备连接目标Oracle数据库的Deployment对象信息
我们要把这个oracledb-exporter运行在Kubernetes里,创建1个Deployment资源对象,Deployment对象挂载ConfigMap,而ConfigMap才是抓取Oracle数据库的metrics,访问目标数据库的连接信息,通过前面创建的oracledb-exporter-secret资源对象来完成。
[root@master-node oracle_exporter]# pwd
/root/oracle_exporter
[root@master-node oracle_exporter]# ll
总用量 8
-rw-r--r-- 1 root root 5459 11月 18 14:25 oracle-db-deployment.yaml
[root@master-node oracle_exporter]# cat oracle-db-deployment.yaml
apiVersion: apps/v1
kind: Deployment
metadata:
  name: oracledb-exporter
  namespace: database-namespace
spec:
  selector:
    matchLabels:
      app: oracledb-exporter
  replicas: 1
  template:
    metadata:
      labels:
        app: oracledb-exporter
      annotations:
        prometheus.io/scrape: "true"
        prometheus.io/port: "9161"
        prometheus.io/path: "/metrics"
    spec:
      containers:
      - name: oracledb-exporter
        ports:
        - containerPort: 9161
          hostPort: 9161
          protocol: TCP
        image: iamseth/oracledb_exporter
        env:
        - name: DATA_SOURCE_NAME
          valueFrom:
            secretKeyRef:
              name: oracledb-exporter-secret
              key: datasource
        - name: CUSTOM_METRICS
          value: /tmp/custom-metrics.toml
        volumeMounts:
          - name:  custom-metrics
            mountPath:  /tmp/custom-metrics.toml
            subPath: custom-metrics.toml
      volumes:
        - name: custom-metrics
          configMap:
            defaultMode: 420
            name: custom-metrics
---
apiVersion: v1
kind: ConfigMap
metadata:
  name: custom-metrics
  namespace: database-namespace
data:
  custom-metrics.toml: |
    [[metric]]
    context = "slow_queries"
    metricsdesc = { p95_time_usecs= "Gauge metric with percentile 95 of elapsed time.", p99_time_usecs= "Gauge metric with percentile 99 of elapsed time." }
    request = "select  percentile_disc(0.95)  within group (order by elapsed_time) as p95_time_usecs, percentile_disc(0.99)  within group (order by elapsed_time) as p99_time_usecs from v$sql where last_active_time >= sysdate - 5/(24*60)"

    [[metric]]
    context = "big_queries"
    metricsdesc = { p95_rows= "Gauge metric with percentile 95 of returned rows.", p99_rows= "Gauge metric with percentile 99 of returned rows." }
    request = "select  percentile_disc(0.95)  within group (order by rownum) as p95_rows, percentile_disc(0.99)  within group (order by rownum) as p99_rows from v$sql where last_active_time >= sysdate - 5/(24*60)"

    [[metric]]
    context = "size_user_segments_top100"
    metricsdesc = {table_bytes="Gauge metric with the size of the tables in user segments."}
    labels = ["segment_name"]
    request = "select * from (select segment_name,sum(bytes) as table_bytes from user_segments where segment_type='TABLE' group by segment_name) order by table_bytes DESC FETCH NEXT 100 ROWS ONLY"

    [[metric]]
    context = "size_user_segments_top100"
    metricsdesc = {table_partition_bytes="Gauge metric with the size of the table partition in user segments."}
    labels = ["segment_name"]
    request = "select * from (select segment_name,sum(bytes) as table_partition_bytes from user_segments where segment_type='TABLE PARTITION' group by segment_name) order by table_partition_bytes DESC FETCH NEXT 100 ROWS ONLY"

    [[metric]]
    context = "size_user_segments_top100"
    metricsdesc = {cluster_bytes="Gauge metric with the size of the cluster in user segments."}
    labels = ["segment_name"]
    request = "select * from (select segment_name,sum(bytes) as cluster_bytes from user_segments where segment_type='CLUSTER' group by segment_name) order by cluster_bytes DESC FETCH NEXT 100 ROWS ONLY"

    [[metric]]
    context = "size_dba_segments_top100"
    metricsdesc = {table_bytes="Gauge metric with the size of the tables in user segments."}
    labels = ["segment_name"]
    request = "select * from (select segment_name,sum(bytes) as table_bytes from dba_segments where segment_type='TABLE' group by segment_name) order by table_bytes DESC FETCH NEXT 100 ROWS ONLY"

    [[metric]]
    context = "size_dba_segments_top100"
    metricsdesc = {table_partition_bytes="Gauge metric with the size of the table partition in user segments."}
    labels = ["segment_name"]
    request = "select * from (select segment_name,sum(bytes) as table_partition_bytes from dba_segments where segment_type='TABLE PARTITION' group by segment_name) order by table_partition_bytes DESC FETCH NEXT 100 ROWS ONLY"

    [[metric]]
    context = "size_dba_segments_top100"
    metricsdesc = {cluster_bytes="Gauge metric with the size of the cluster in user segments."}
    labels = ["segment_name"]
    request = "select * from (select segment_name,sum(bytes) as cluster_bytes from dba_segments where segment_type='CLUSTER' group by segment_name) order by cluster_bytes DESC FETCH NEXT 100 ROWS ONLY"

    [[metric]]
    context = "resource"
    labels = [ "resource_name" ]
    metricsdesc = { current_utilization= "Generic counter metric from v$resource_limit view in Oracle (current value).", limit_value="Generic counter metric from v$resource_limit view in Oracle (UNLIMITED: -1)." }
    request="SELECT resource_name,current_utilization,CASE WHEN TRIM(limit_value) LIKE 'UNLIMITED' THEN '-1' ELSE TRIM(limit_value) END as limit_value FROM v$resource_limit"

    [[metric]]
    context = "process"
    metricsdesc = { count="Gauge metric with count of processes." }
    request = "SELECT COUNT(*) as count FROM v$process"

---
apiVersion: v1
kind: Secret
metadata:
  name:  oracledb-exporter-secret
  namespace: database-namespace
data:
    # Add here the result of:
    # echo -n YOUR_CONN_STRING | base64
    # YOUR_CONN_STRING be like: system/YOUR-PASS-FOR-SYSTEM@//database:1521/DB_SID.DB_DOMAIN
    datasource: c3lzdGVtL29yYWNsZUAvLzE3Mi4xNi4xNy40MToxNTIxL2RldnBkYg==
type: Opaque
[root@master-node oracle_exporter]#
注意📢📢📢,Deployment管控的pod,我们指定了hostPort: 9161字段,这样将来这个pod不管调度到Kubernetes cluster的哪个worker node上,就会在那个node上暴露9161端口给外部,prometheus才可以通过worker node IP+9161端口,抓取pull到采集的目标Oracle数据库的指标数据。
0.3 创建namespace资源对象database-namespace
[root@master-node oracle_exporter]# pwd
/root/oracle_exporter
[root@master-node oracle_exporter]# ll
总用量 8
-rw-r--r-- 1 root root 5459 11月 18 14:25 oracle-db-deployment.yaml
[root@master-node oracle_exporter]# kubectl create ns database-namespace
namespace/database-namespace created
[root@master-node oracle_exporter]# kubectl get ns
NAME                 STATUS   AGE
database-namespace   Active   3s
default              Active   111d
kube-node-lease      Active   111d
kube-public          Active   111d
kube-system          Active   111d
mysql                Active   45d
ns1                  Active   74d
test                 Active   82d
[root@master-node oracle_exporter]#
0.4 启动运行oracledb-exporter Deployment
[root@master-node oracle_exporter]# kubectl apply -f oracle-db-deployment.yaml
deployment.apps/oracledb-exporter created
configmap/custom-metrics created
secret/oracledb-exporter-secret created
[root@master-node oracle_exporter]# kubectl -n database-namespace get all -owide
NAME                                     READY   STATUS    RESTARTS   AGE   IP           NODE     NOMINATED NODE   READINESS GATES
pod/oracledb-exporter-7d6c8cc59c-slpbp   1/1     Running   0          11s   10.244.2.8   node-2   <none>           <none>

NAME                                READY   UP-TO-DATE   AVAILABLE   AGE   CONTAINERS          IMAGES                      SELECTOR
deployment.apps/oracledb-exporter   1/1     1            1           11s   oracledb-exporter   iamseth/oracledb_exporter   app=oracledb-exporter

NAME                                           DESIRED   CURRENT   READY   AGE   CONTAINERS          IMAGES                      SELECTOR
replicaset.apps/oracledb-exporter-7d6c8cc59c   1         1         1       11s   oracledb-exporter   iamseth/oracledb_exporter   app=oracledb-exporter,pod-template-hash=7d6c8cc59c
[root@master-node oracle_exporter]# kubectl get nodes -owide
NAME          STATUS   ROLES                  AGE    VERSION   INTERNAL-IP     EXTERNAL-IP   OS-IMAGE                KERNEL-VERSION          CONTAINER-RUNTIME
master-node   Ready    control-plane,master   111d   v1.23.1   172.16.11.168   <none>        CentOS Linux 7 (Core)   3.10.0-693.el7.x86_64   docker://1.13.1
node-1        Ready    <none>                 111d   v1.23.1   172.16.11.148   <none>        CentOS Linux 7 (Core)   3.10.0-862.el7.x86_64   docker://1.13.1
node-2        Ready    <none>                 111d   v1.23.1   172.16.11.161   <none>        CentOS Linux 7 (Core)   3.10.0-862.el7.x86_64   docker://1.13.1
[root@master-node oracle_exporter]#
至此,看到Deployment管控的pod运行在node2上,node2的IP为172.16.11.161。
0.5 校验metris正常抓取
[root@master-node oracle_exporter]# curl http://172.16.11.161:9161/metrics
# HELP go_gc_duration_seconds A summary of the GC invocation durations.
# TYPE go_gc_duration_seconds summary
go_gc_duration_seconds{quantile="0"} 1.3341e-05
....
process_virtual_memory_bytes 2.190381056e+09
# HELP process_virtual_memory_max_bytes Maximum amount of virtual memory available in bytes.
# TYPE process_virtual_memory_max_bytes gauge
process_virtual_memory_max_bytes -1
[root@master-node oracle_exporter]#
这里,可以看到非常多的metrics,说明抓取正常。
1 下载安装运行prometheus
1.1 下载prometheus
到prometheus官网下载对应平台的软件,我这里下载的MacOS的prometheus:
wget https://github.com/prometheus/prometheus/releases/download/v2.40.1/prometheus-2.40.1.darwin-amd64.tar.gz
unzip prometheus-2.40.1.darwin-amd64.tar.gz
cd prometheus-2.40.1.darwin-amd64/
1.2 修改prometheus.yml:
asher at MacBook-Air-3 in ~/prometheus-2.40.1.darwin-amd64
$ cat prometheus.yml
# my global config
global:
  scrape_interval: 15s # Set the scrape interval to every 15 seconds. Default is every 1 minute.
  evaluation_interval: 15s # Evaluate rules every 15 seconds. The default is every 1 minute.
  # scrape_timeout is set to the global default (10s).

# Alertmanager configuration
alerting:
  alertmanagers:
    - static_configs:
        - targets:
          - localhost:9093

# Load rules once and periodically evaluate them according to the global 'evaluation_interval'.
rule_files:
  # - "first_rules.yml"
  # - "second_rules.yml"
    - "simulator.yml"

# A scrape configuration containing exactly one endpoint to scrape:
# Here it's Prometheus itself.
scrape_configs:
  # The job name is added as a label `job=<job_name>` to any timeseries scraped from this config.
  - job_name: "prometheus"

    # metrics_path defaults to '/metrics'
    # scheme defaults to 'http'.

    static_configs:
      - targets: ["localhost:9090"]

  - job_name: "http-simulator"

    # metrics_path defaults to '/metrics'
    # scheme defaults to 'http'.

    metrics_path: /prometheus
    static_configs:
      - targets: ["localhost:8080"]

  - job_name: "oracle"

    # metrics_path defaults to '/metrics'
    # scheme defaults to 'http'.

    metrics_path: /metrics
    static_configs:
      - targets: ["172.16.11.161:9161"]

asher at MacBook-Air-3 in ~/prometheus-2.40.1.darwin-amd64
$
其中,添加最后一部分是对Oracle的抓取配置信息。其它部分,是我本地对其它信息的抓取配置。
1.3 启动prometheus:
asher at MacBook-Air-3 in ~/prometheus-2.40.1.darwin-amd64
$ ./prometheus --config.file prometheus.yml --web.enable-lifecycle
...
ts=2022-11-18T08:38:58.260Z caller=main.go:512 level=info msg="No time or size retention was set so using the default time retention" duration=15d
ts=2022-11-18T08:38:58.261Z caller=main.go:556 level=info msg="Starting Prometheus Server" mode=server version="(version=2.40.1, branch=HEAD, revision=965274259f993801d63f553639d248588287120b)"
ts=2022-11-18T08:38:58.261Z caller=main.go:561 level=info build_context="(go=go1.19.3, user=root@09c091b0e988, date=20221109-14:30:41)"
...
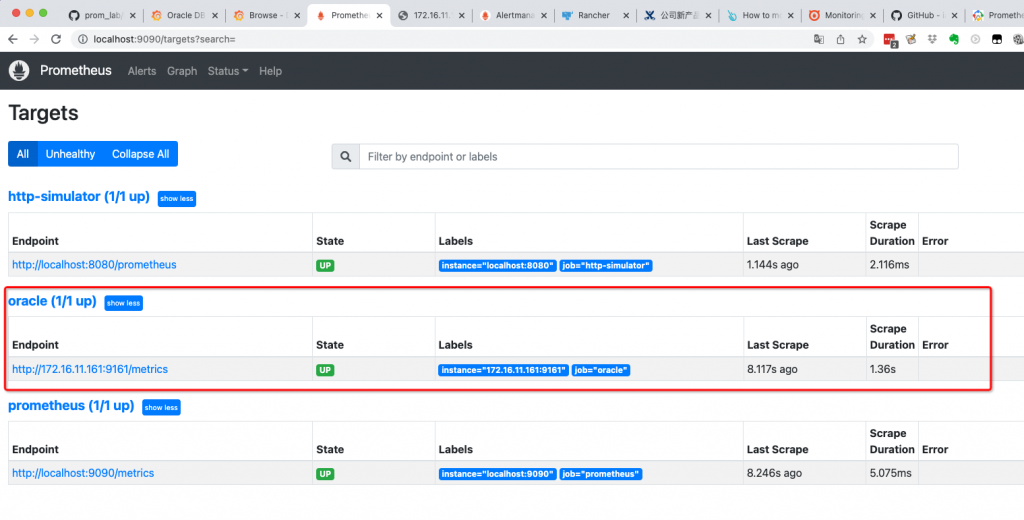
1.4 访问prometheus,验证目标对象抓取正常:
http://localhost:9090/targets?search=
2 下载安装运行grafana
2.1 下载解压grafana
$ pwd
/Users/asher

asher at MacBook-Air-3 in ~
$ curl -O https://dl.grafana.com/enterprise/release/grafana-enterprise-9.2.4.darwin-amd64.tar.gz
  % Total    % Received % Xferd  Average Speed   Time    Time     Time  Current
                                 Dload  Upload   Total   Spent    Left  Speed
100 95.5M  100 95.5M    0     0  8933k      0  0:00:10  0:00:10 --:--:-- 9893k

asher at MacBook-Air-3 in ~
$ tar -zxvf grafana-enterprise-9.2.4.darwin-amd64.tar.gz
x grafana-9.2.4/LICENSE
x grafana-9.2.4/README.md
...
2.2 运行grafana
$ cd grafana-9.2.4/
asher at MacBook-Air-3 in ~/grafana-9.2.4
$ ./bin/grafana-server
INFO [11-14|08:44:28] Starting Grafana                         logger=settings version=9.2.4 commit=64017e8ca6 branch=HEAD compiled=2022-11-08T18:38:42+08:00
INFO [11-14|08:44:28] Config loaded from                       logger=settings file=/Users/asher/grafana-9.2.4/conf/defaults.ini
INFO [11-14|08:44:28] Path Home                                logger=settings path=/Users/asher/grafana-9.2.4
INFO [11-14|08:44:28] Path Data                                logger=settings path=/Users/asher/grafana-9.2.4/data
INFO [11-14|08:44:28] Path Logs                                logger=settings path=/Users/asher/grafana-9.2.4/data/log
...
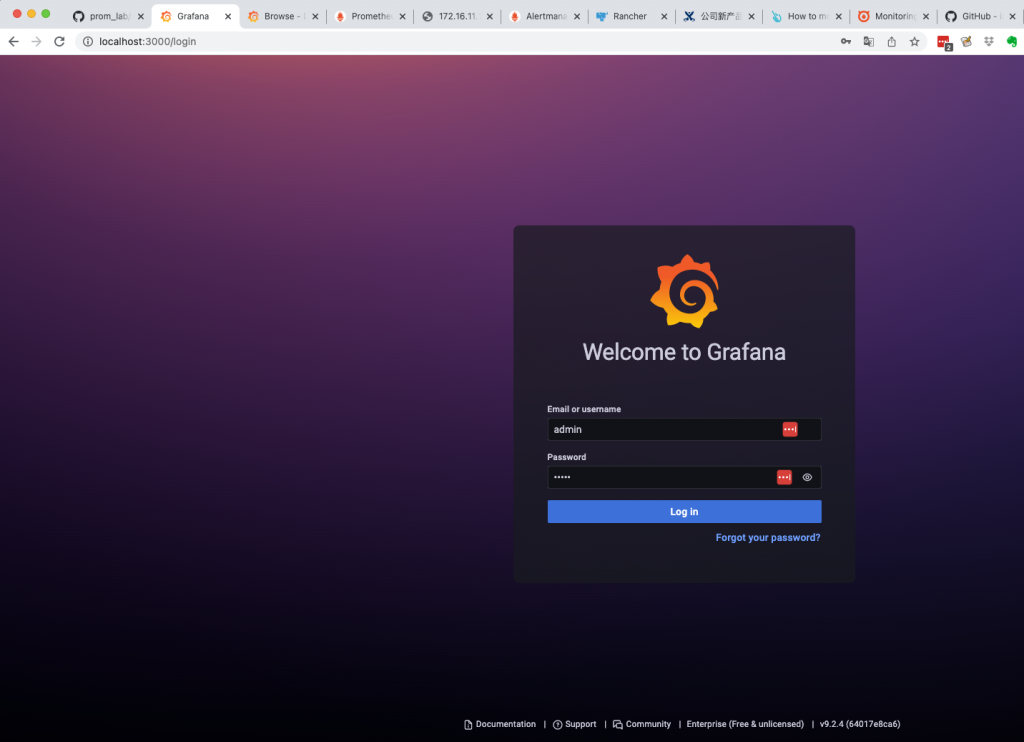
2.3 访问grafana
用户名和密码默认都是admin登录。
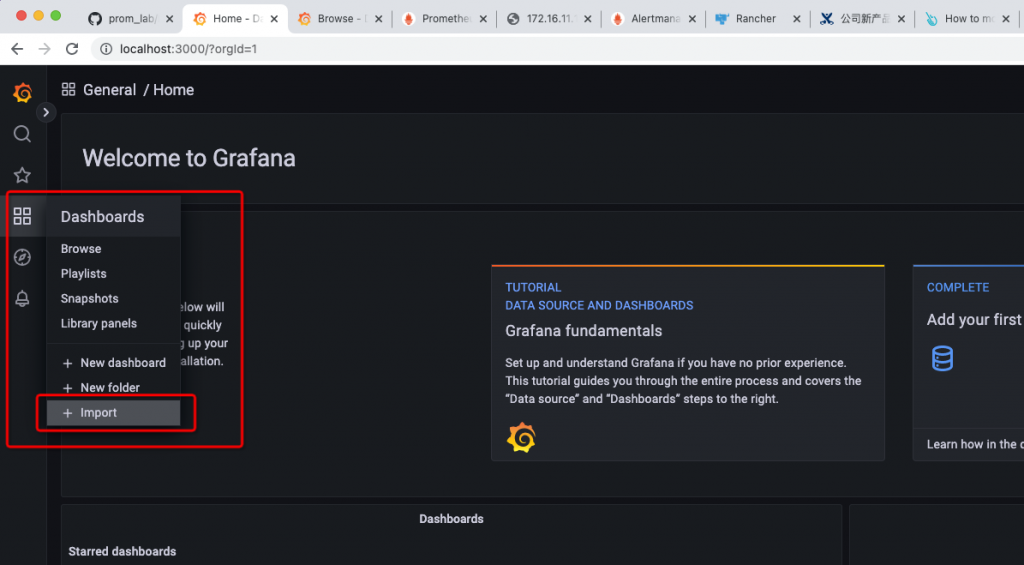
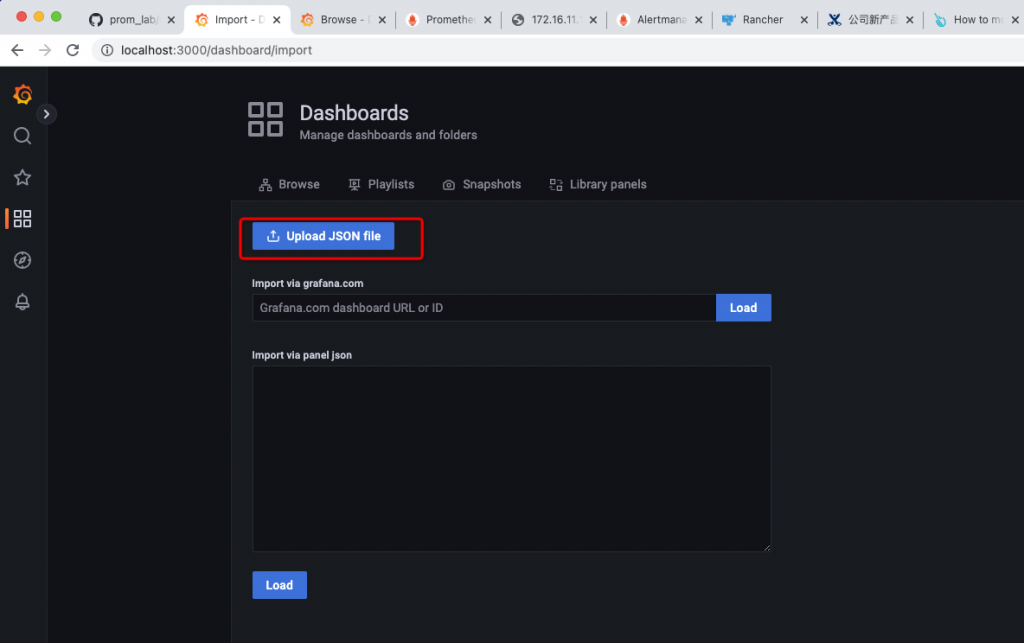
2.4 下载并导入dashboard
从 https://promcat.io/apps/oracle-database/19.3.0.0 下载dashboard。
然后,到grafana web界面菜单,选择导入:
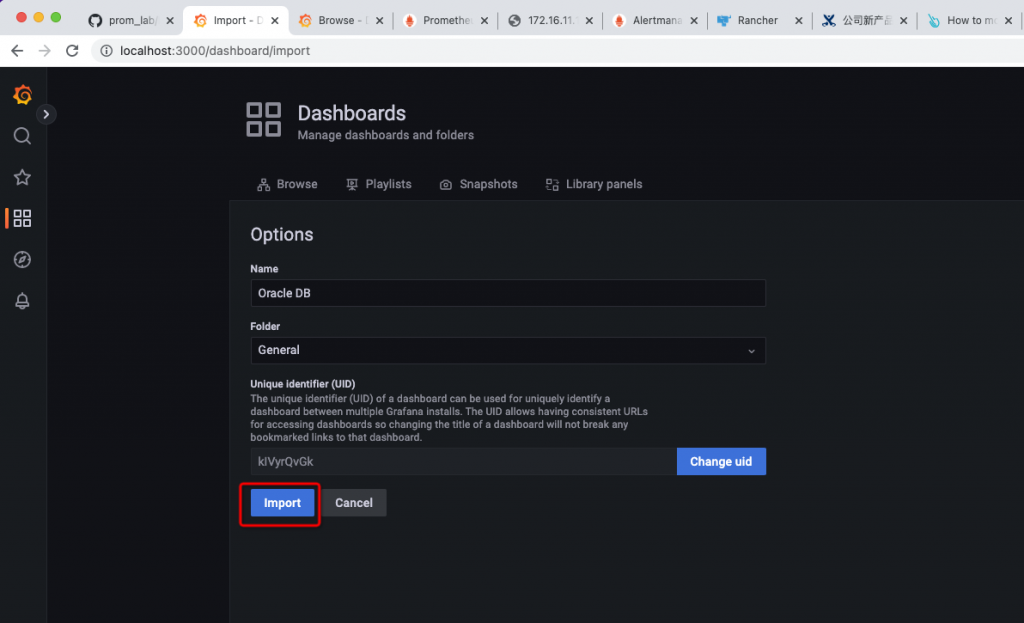
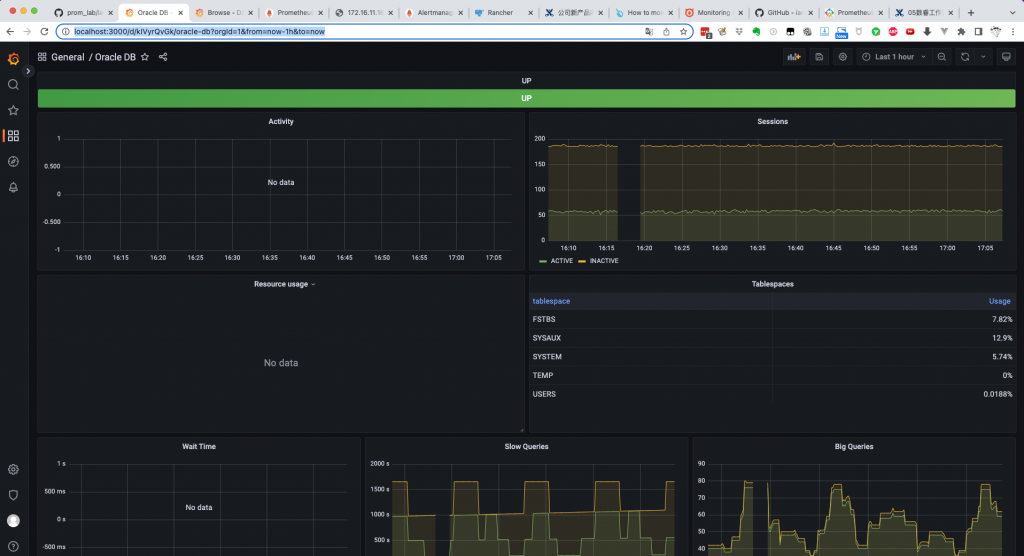
2.5 查看监控信息
http://localhost:3000/d/kIVyrQvGk/oracle-db?orgId=1&from=now-1h&to=now
三小结和参考
通过prometheus+grafana开源监控系统,完成了对Oracle数据库的初步监控。
其中,exporter运行在Kubernetes里,引入了ConfigMap资源对象,secret对象。此步骤非必须,也可以把exporter直接运行在被监控的Oracle数据库服务器上「或者其它有Oracle运行环境的机器也可以,才可以抓取到目标数据库」,再或者直接把exporter运行在docker中也可以。
核心是ConfigMap里写的metrics,我们可以逐步增加和完善这里的metrics。
参考:
https://github.com/iamseth/oracledb_exporter
https://promcat.io/apps/oracle-database/19.3.0.0